When I first entered the world of systematic trading, I quickly realized that I needed an effective automated way to determine the size of my trades. Many professionals stressed the importance of risk management and position sizing, but I had no idea how to approach it. I heard a lot about the Kelly criterion, but I had the feeling that most people who talked about it did not fully understand it. Upon further research, I discovered that the original Kelly criterion was not designed for trading and, in its simple form, could not be applied in a meaningful way.
The Kelly criterion is essentially a formula for sizing bets in a game with two known outcomes and probabilities of occurrence, played a certain number of times. This means that you either win a certain percentage of your bet with a certain probability, or you lose a certain percentage of your bet with the opposite probability.
To illustrate this, let’s look at an example from Wikipedia. Imagine that an unfair coin is tossed with a probability of 60% for heads. If the coin lands on heads, you double your bet, but if it lands on tails, you lose your entire bet. Since this game is played multiple times, it’s crucial to determine the optimal size of your bet. According to Kelly’s criterion, betting 20% of your total capital is the best strategy for maximizing your returns. We’ll take a closer look at how this calculation works in just a moment.
However, the original Kelly criterion cannot be applied directly to the market. To make it more applicable to trades and markets, we need to generalize it further. For instance, we need to consider multiple outcomes rather than just two, and assume that we have knowledge of the distribution of our future outcomes. This would be more practical since trades and markets typically involve multiple possible outcomes, not just two. While it’s true that trades are not typically placed sequentially, but rather in parallel, we’ll set that issue aside for now and focus on developing a more practical version of the Kelly criterion for trades and markets.
Lets derive that thing …
Many traders use the Compound Annual Growth Rate (CAGR) or the Geometric Mean of their trades to evaluate their investment performance. Building on this perspective, we can derive a more general Kelly criterion by maximizing these measures. Let us assume that our portfolio value after the ![]() -th trade is denoted by
-th trade is denoted by ![]() , where
, where ![]() represents the initial value and
represents the initial value and ![]() represents the final value after
represents the final value after ![]() trades. Furthermore, we define
trades. Furthermore, we define ![]() as the return of the
as the return of the ![]() -th trade. To determine the fraction of our portfolio value we want to invest, which is our position size, we introduce the variable
-th trade. To determine the fraction of our portfolio value we want to invest, which is our position size, we introduce the variable ![]() .
.
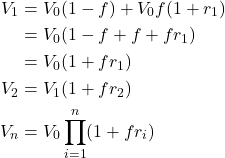
Our objective is to identify the value of ![]() that maximizes the CAGR or, more generally, the geometric mean of returns (as we may not place just one bet per year). This amounts to maximizing our average return over the investment horizon. To this end, we define the geometric mean and apply it to our particular situation.
that maximizes the CAGR or, more generally, the geometric mean of returns (as we may not place just one bet per year). This amounts to maximizing our average return over the investment horizon. To this end, we define the geometric mean and apply it to our particular situation.
![Rendered by QuickLaTeX.com \begin{equation*}\begin{split}V_0 (1+\bar{r}_g)^n & = V_n = V_0 \displaystyle\prod_{i=1}^{n} (1+ f r_i) \\ (1+\bar{r}_g)^n & = \displaystyle\prod_{i=1}^{n} (1+ f r_i) \\ \bar{r}_g & = \sqrt[n]{\displaystyle\prod_{i=1}^{n} (1+ f r_i)} - 1 \\ \bar{r}_g & = \exp \bigg( \frac{1}{n} \sum_{i=1}^{n} \log (1+ f r_i) \bigg) - 1\end{split} \end{equation*}](https://finblobs.com/wp-content/ql-cache/quicklatex.com-57ed10646f941963b257cdabcc6f9ae3_l3.png)
The final line is a mathematical technique that eliminates the need for the product sign. As previously noted, we must work with expected values since ![]() , … ,
, … , ![]() are random variables. Furthermore, we assume that these variables are independent and identically distributed, with an expected value of
are random variables. Furthermore, we assume that these variables are independent and identically distributed, with an expected value of ![]() and a standard deviation of
and a standard deviation of ![]() . By exploiting the monotonicity of exponential functions, we can concentrate on the exponent to optimize the geometric mean.
. By exploiting the monotonicity of exponential functions, we can concentrate on the exponent to optimize the geometric mean.
![]()
Exploiting the Taylor series for the natural logarithm, we can now obtain:
![]()
As the terms become progressively smaller, we may limit our attention to the first two. To obtain the maximum, we differentiate the function f and set it equal to zero.
![Rendered by QuickLaTeX.com \begin{equation*}\begin{split}& \frac{\delta}{\delta f} \mathrm{E} [ \log (1+ f r) ] \\=& \frac{\delta}{\delta f} \mathrm{E} \bigg[ fr - \frac{(fr)^2}{2} \bigg] \\=& \frac{\delta}{\delta f} \mathrm{E} [ fr ] - \frac{\delta}{\delta f} \mathrm{E} \bigg[\frac{(fr)^2}{2} \bigg] \\=& \mathrm{E} [ r ] - f \mathrm{E} [r^2 ] = 0\end{split}\end{equation*}](https://finblobs.com/wp-content/ql-cache/quicklatex.com-40f7ac217f67cc78bdf61fc1eced982b_l3.png)
Utilizing the expression ![]() , we can now derive the ultimate formula.
, we can now derive the ultimate formula.
![]()
Lets verify that thing …
This expression looks promising and should work with any distribution. Let’s verify if the recommendation obtained from our formula is similar to the one for the Wikipedia example. The expected value of each game is ![]() , and the variance is
, and the variance is ![]() . Plugging these values into our formula, we also obtain the suggestion to bet 20% each round (Note that the formula from Wikipedia and the formula derived here are not 100% the same, but very close.)
. Plugging these values into our formula, we also obtain the suggestion to bet 20% each round (Note that the formula from Wikipedia and the formula derived here are not 100% the same, but very close.)
Well, since we have now a more general formula at hand, which is also applicable for more than 2 outcomes and we also know that everything is normal distributed 😉 , lets look at a normal distribution with ![]() and
and ![]() .
.
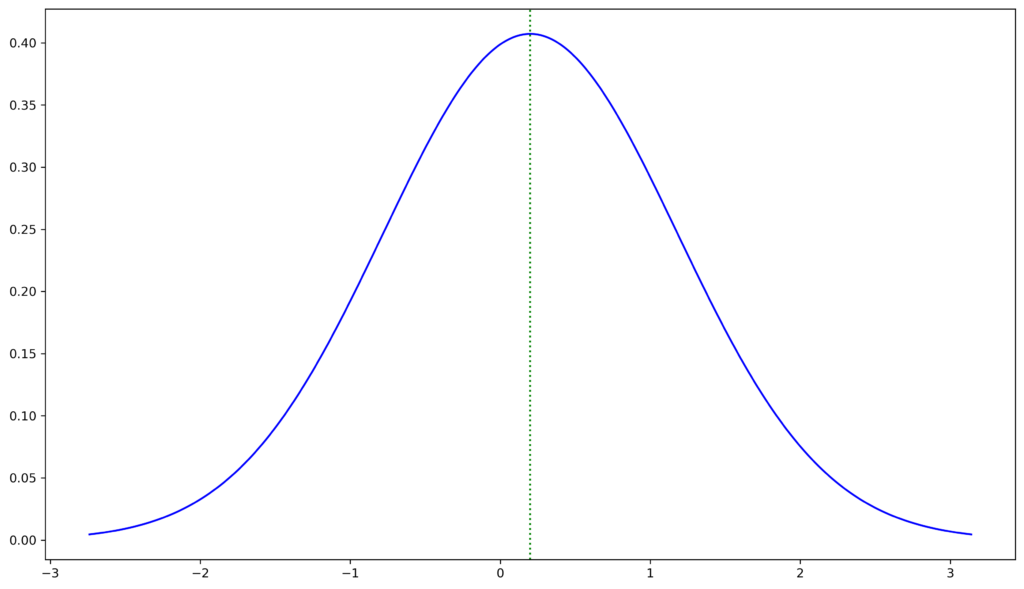
While it’s true that we seem to have a slight edge in this situation, it’s important to remember that there’s still a significant probability of losing everything and more. So, while the Kelly criterion suggests betting 20% of our capital to maximize the geometric mean, we should ask ourselves if this is always the optimal choice. It’s also worth noting that the geometric mean can only be properly calculated if ![]() stays strictly positive for all
stays strictly positive for all ![]() . If it’s zero or even negative, this means total ruin. According to the Kelly criterion, the probability of getting a return of -5 or less in this example is only 5.5653e-8. However, this probability depends on how often we play this game. If we’re high-frequency traders, we may want to think twice before betting on this game.
. If it’s zero or even negative, this means total ruin. According to the Kelly criterion, the probability of getting a return of -5 or less in this example is only 5.5653e-8. However, this probability depends on how often we play this game. If we’re high-frequency traders, we may want to think twice before betting on this game.
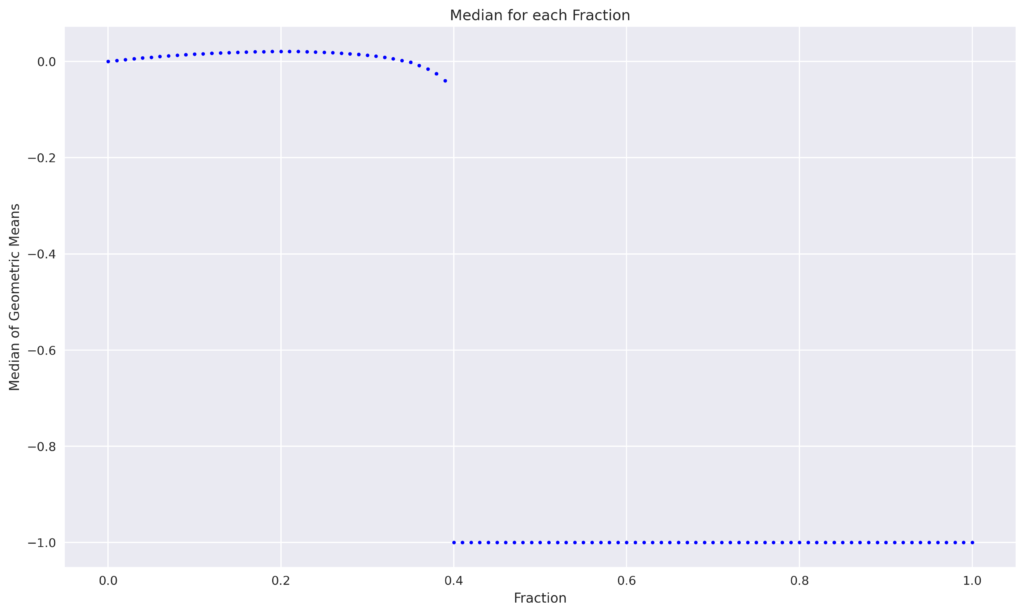
Lets try to calculate the optimal fraction numerically. Here is the setup:
- We test each fraction from 0% to 100%, incrementing by 1% each time, resulting in 101 fractions.
- The concept is to invest on a daily basis throughout the year, resulting in approximately 256 trading days. The geometric mean is then computed from these 256 returns, constituting a single trial.
- We conduct a total of 1000 trials, resulting in 101000 calculations of the geometric mean for each fraction. This produces a total of 25,856,000 random draws from the distribution.
- If
 becomes 0 or negative in any trial we return a geometric mean of -1.
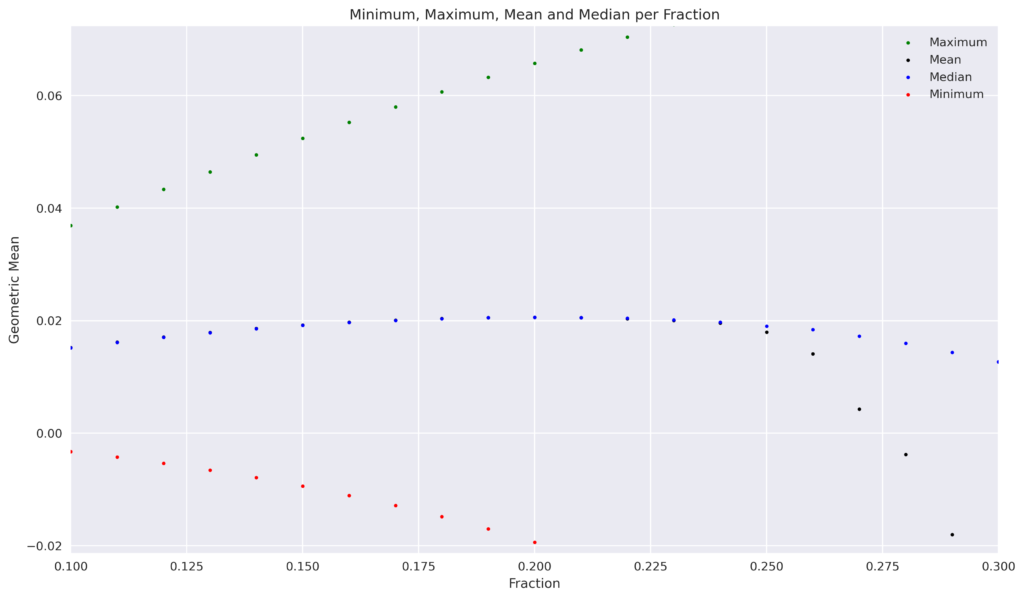
When determining the optimal fraction by taking the mean or median of the 1000 trials for each fraction, we also observe that the optimal fraction is 20%. The following table shows the results for half of the Kelly fraction, the Kelly fraction, and twice the Kelly fraction.
| Fraction | 0.1 | 0.2 | 0.4 |
| Mean | 0.015207 | 0.020601 | -0.525023 |
| Median | 0.015161 | 0.020612 | -1.000000 |
| Minimum | -0.003276 | -0.019376 | -1.000000 |
| Maximum | 0.036911 | 0.065729 | 0.079640 |
| Gemetric Mean > 0.0 | 0.995000 | 0.947000 | 0.239000 |
| Probability of Ruin | 0.000000 | 0.000000 | 0.525000 |
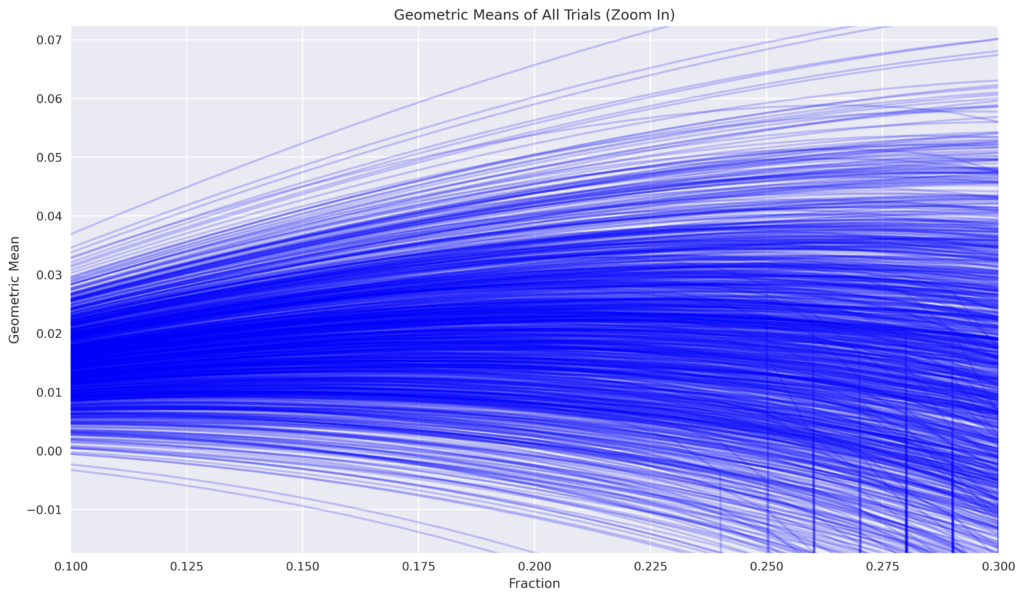
It is evident that none of the trials resulted in complete ruin for the 10% and 20% fractions. Conversely, twice the Kelly fraction results in over half of the trials leading to complete ruin. The figures below illustrate that even at a fraction of 25%, certain trials result in ruin, with the frequency increasing gradually until the median of all trials reaches -1, beginning at a fraction of 40%.

Lets conclude something …
To me, picking a 20% fraction in the above example is already quite risky, considering that a 25% fraction has a real possibility of losing everything. However, let’s consider another example from one of my recent backtested strategies, where I observed a CAGR of 23.08% and an annualized standard deviation of 28.52%. The leverage recommended by the Kelly criterion would be 1.7146, which is ridiculous high, especially given that the maximum drawdown observed in the backtest was -51.06%. And that’s just the backtest, who knows what will happen in the future.
While the Kelly criterion may seem like a smart approach to position sizing, I prefer to keep things practical and grounded in reality. It’s all well and good to theorize about future trades, but without knowing the distribution, mean, or variance, we’re really just shooting in the dark. As the good old disclaimer goes, past performance is no guarantee of future results. In addition, neglecting to factor in extreme events results in an excessive amount of risk exposure.
Lets reads more about that thing …
- Thanks to elemolotiv who asked a lot of very helpful questions on stackexchange. I also stole most of his derivation.
- The original paper from Kelly and a more general one from Merton.
- An interesting blog post by Rob Carver on Kelly versus classical portfolio theory.