The S&P 500, consisting of 500 of the largest publicly traded companies in the US, is often considered a gold standard for market performance. But here’s a thought-provoking question: Do you truly need all 500 stocks to achieve optimal results? In this blog post, we’ll dive into a data analysis that challenges the notion of quantity and explores whether a smaller selection of stocks can deliver comparable outcomes.
First let’s replicate the SPY
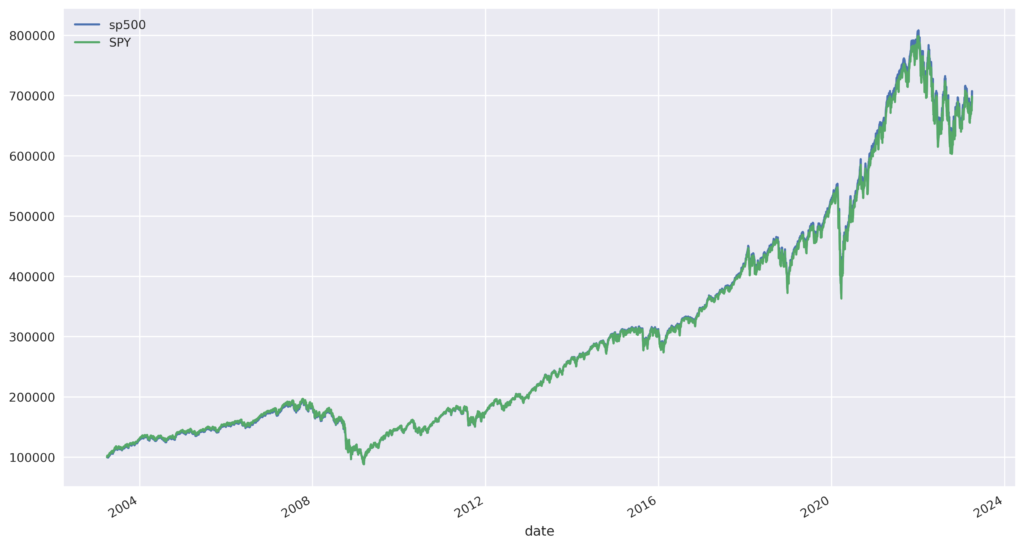
To establish a firm foundation for our analysis, I undertook the task of replicating the S&P 500 using historical constituents and price data from two decades ago. The primary objective was to compare the performance of this replication with that of the actual S&P 500, as represented by the SPY ETF. The results were highly promising, as depicted in the graph below, where the equity curves of both our replication and the SPY ETF closely mirrored each other. This robust replication process not only affirmed the accuracy of our data analysis but also strengthened its validity.

Exploring Different Stock Indexes
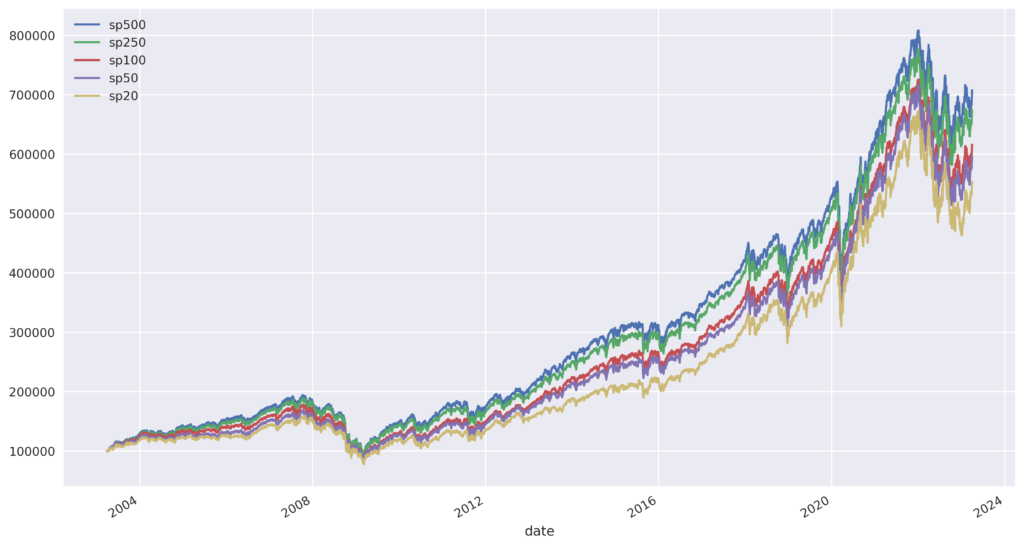
With the replication successfully completed, it was time to explore whether having fewer stocks in a portfolio could still deliver strong returns and effective risk management. Using our replication as a foundation, I also constructed portfolios that encompassed the top 250 stocks (sp250), the top 100 stocks (sp100), the top 50 stocks (sp50), and the top 20 stocks (sp20). I sorted by market capitalization which I also used for position sizing.
The results revealed a notable trend: as the number of stocks decreased, so did the returns and the Sharpe ratio, which is a measure of risk-adjusted returns. While the S&P 500, with its full complement of 500 stocks, demonstrated robust performance and favorable risk-adjusted returns, the portfolios with fewer stocks exhibited diminished results. This suggests that diversification across a larger number of stocks offers potential benefits in terms of both performance and risk management.
To visualize these results, refer to the following table, which showcases the annualized rate of return, annualized standard deviation, Sharpe ratio, maximum drawdown, as well as the accompanying graph.
| AROR | ASTD | SR | MAX_DD | |
| sp500 | 0.1046 | 0.1922 | 0.5442 | 0.5451 |
| sp250 | 0.1019 | 0.1894 | 0.5382 | 0.5337 |
| sp100 | 0.0968 | 0.1892 | 0.5117 | 0.5392 |
| sp50 | 0.0951 | 0.1886 | 0.5042 | 0.5132 |
| sp20 | 0.0908 | 0.1928 | 0.4710 | 0.5123 |

Equal Weighting Consideration
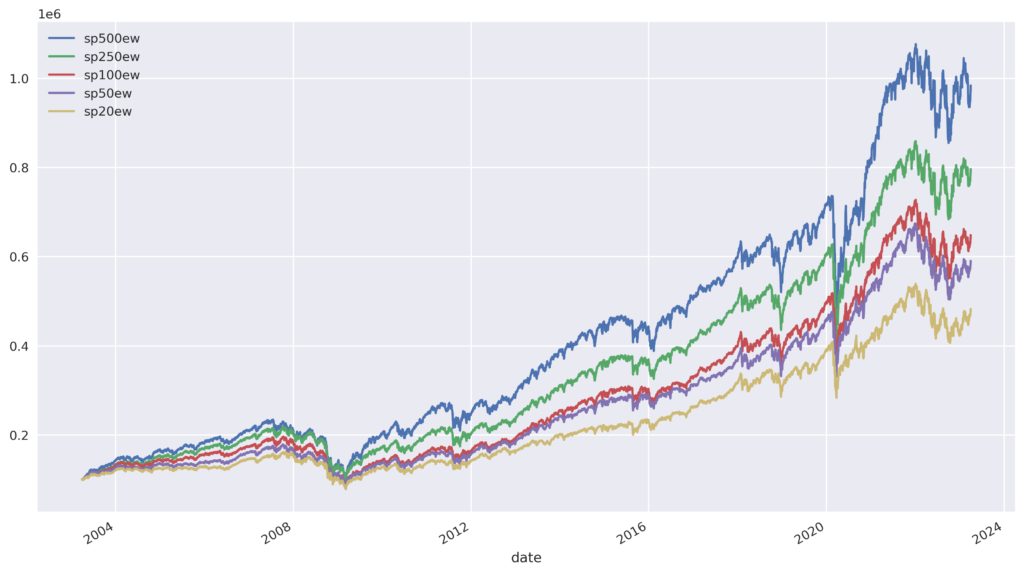
To gain further insights into the impact of diversification, I repeated the analysis, this time with equal-weighted portfolios. The portfolios of the sp250ew, sp100ew, sp50ew, and sp20ew—utilizing equal weighting—yielded similar outcomes. While there was a slight increase in returns, it was accompanied by a corresponding rise in risk. Therefore, while equal weighting may provide a modest performance boost, it also introduces a higher level of risk compared to the traditional market-cap weighting approach.
| AROR | ASTD | SR | MAX_DD | |
| sp500ew | 0.1233 | 0.2114 | 0.5831 | 0.5789 |
| sp250ew | 0.1112 | 0.1940 | 0.5733 | 0.5457 |
| sp100ew | 0.0997 | 0.1906 | 0.5231 | 0.5656 |
| sp50ew | 0.0945 | 0.1848 | 0.5113 | 0.5192 |
| sp20ew | 0.0833 | 0.1856 | 0.4488 | 0.5171 |

Conclusion
The data analysis presents a compelling case for the inclusion of a significant number of stocks, such as the 500 found in the S&P 500, in a portfolio. Despite the allure of simplicity and potential gains associated with smaller stock indexes, the evidence suggests that diversification across a larger number of stocks leads to superior risk-adjusted returns. While replicating the S&P 500 with fewer stocks may produce similar equity curves, the diminished returns and Sharpe ratio underscore the importance of broad exposure to market sectors and individual companies.